Economics
Environment
Policy
Technology
ancillary services, battery storage, BESS, CEA, CERC, climate policy India, coal flexibilisation, distribution reform, duck curve, electricity grid, energy economics, Energy Infrastructure, Energy policy India, energy storage, frequency regulation, grid stability, grid-forming inverters, Grid-India, HP-DAM, IEX, India energy transition, India power sector, Indian Energy Exchange, MNRE, National Electricity Plan, NTPC, peak power demand, power markets, pumped hydro storage, renewable curtailment, renewable energy integration, Smart Metering, solar curtailment, State Grid China, synchronous condensers, time-of-day tariffs, transmission infrastructure
AnilMehta
The duck curve comes for India’s renewable transition
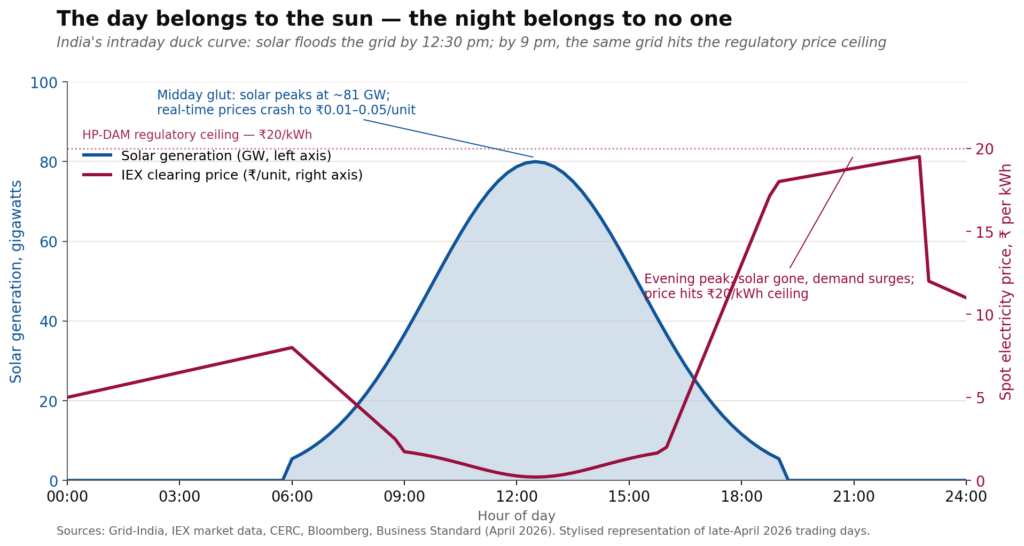
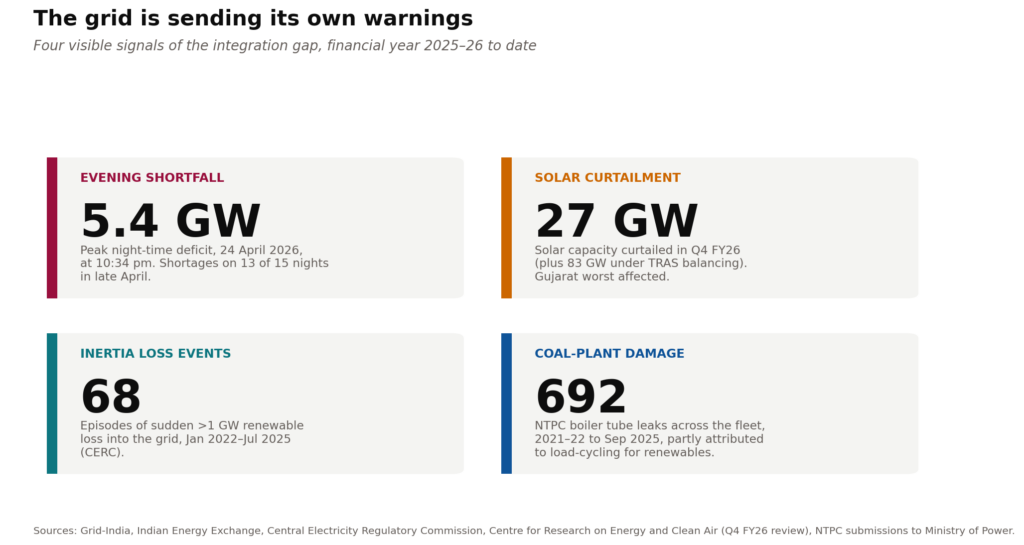
At 3.38 pm on 25 April, India set a new peak power-demand record of 256 gigawatts and met it without shortage. Solar alone delivered 57 GW. Seven hours later, the same grid fell 4.2 GW short. The previous evening, the shortfall touched 5.4 GW at 10.34 pm. Late April produced shortages on 13 of 15 nights — not when demand was highest, but several hours after the sun had set.
The contradiction defines India’s transition. By day, real-time clearing prices on the Indian Energy Exchange collapse to a paisa or two per unit. By night, the high-price day-ahead segment hits its ₹20-per-unit regulatory ceiling. A twentyfold price swing within twelve hours is no longer an aberration; it is the daily signal of a system that has built generation faster than it has built the architecture to absorb it.
The capacity build deserves its applause. Roughly 65 GW was added in financial year 2025-26, the most ever. Solar now sits at about 150 GW, wind near 56 GW, and non-fossil sources crossed half of installed capacity midway through last year. But the very penetration that secured the headlines has destabilised operations. Around 40 per cent of the energy connected to the grid now comes from inertia-free sources — solar panels and wind turbines that produce when the weather decides, transmit every flicker through power electronics, and possess none of the rotating mass that coal and hydro turbines lend the system for free.
India is not the first country to walk this road. California coined the term “duck curve” in 2013 and lived with the evening-ramp problem for nearly a decade. South Australia ran its grid at 64 per cent renewable penetration with almost no spinning mass. On 28 April 2025, Spain and Portugal lost power for up to 18 hours after their grid collapsed in eight seconds at a record 59 per cent instantaneous solar share. Each is instructive. None offers more than five years of head-start. Three structural deficits separate India from the trajectories of the first two and lean it toward the third.
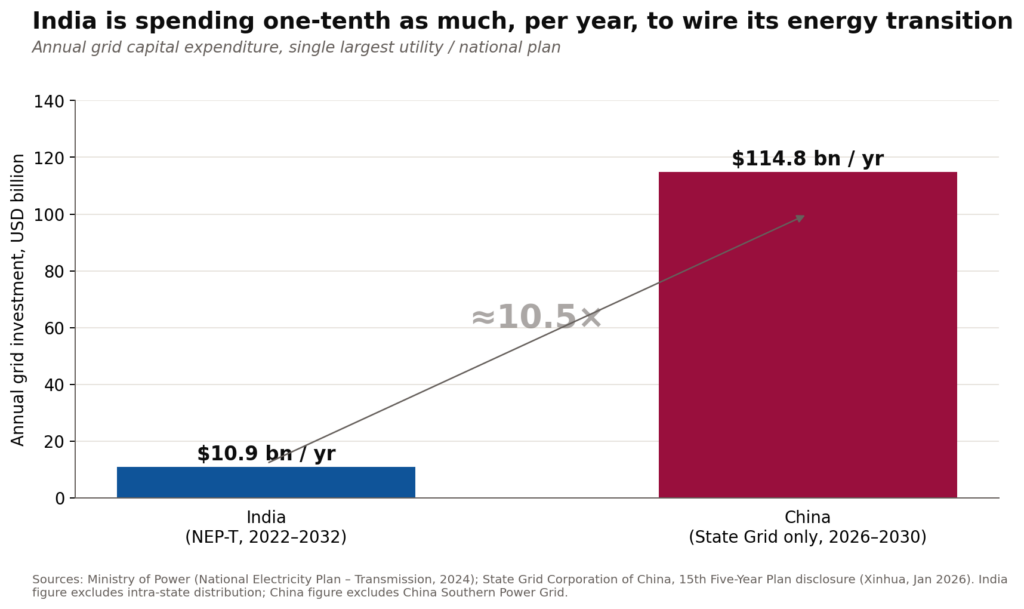
The first is transmission. Rajasthan, which hosts the country’s largest solar build-out, cannot evacuate up to 60 GW of planned capacity to the consuming states. Between 11 am and 2 pm on a typical day, about 4 GW of commissioned renewable energy is simply switched off because the wires cannot carry it. The National Electricity Plan (Transmission) envisages roughly ₹9.15 lakh crore — about $109 billion — to 2032. The figure sounds large until it is placed beside State Grid Corporation of China’s $574 billion over just 2026-2030, and that is one Chinese utility. On a per-year basis, India is spending about a tenth.
Germany offers the cleanest parallel for what happens when transmission lags. Its flagship north-south corridors, SuedLink and SuedOstLink, were planned in 2014 for commissioning by 2022. They are now scheduled for 2027-28 after roughly a decade of delays driven by land acquisition and federal-state coordination failures. Germany has been paying €3–4 billion a year in “redispatch” costs — paying northern wind farms to stop and southern gas plants to start — purely because the wires don’t exist. India’s 25 delayed inter-state transmission projects are imposing the same hidden tax in the form of curtailed solar and stressed coal.
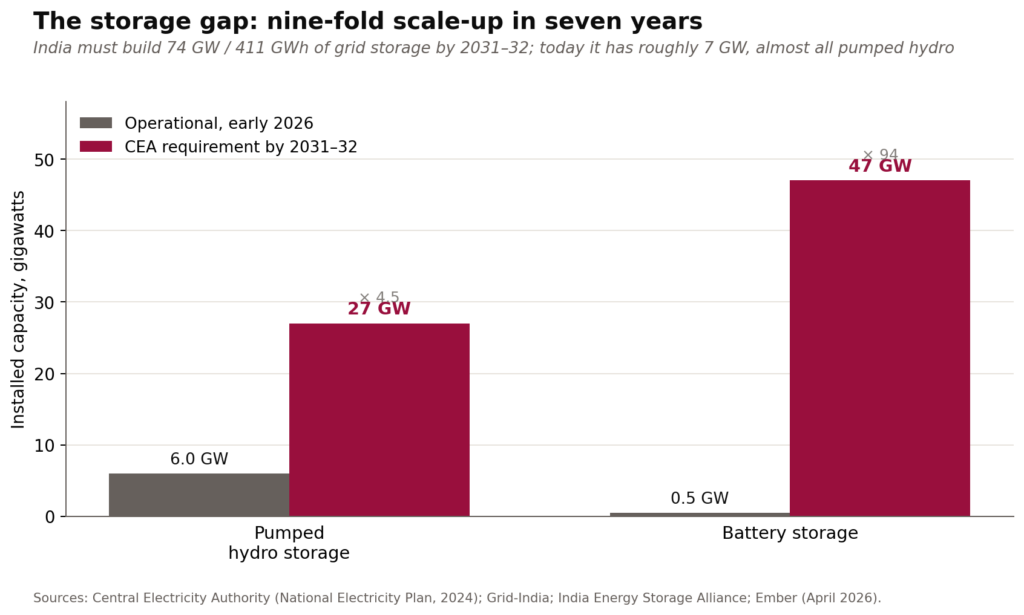
The second is storage. India operates around 7 GW of pumped hydro and barely half a gigawatt of grid-scale batteries. The Central Electricity Authority’s target for 2031-32 is 74 GW — 411 GWh — split roughly between 47 GW of batteries and 27 GW of pumped storage. That requires a nine- to ten-fold scale-up in seven years.
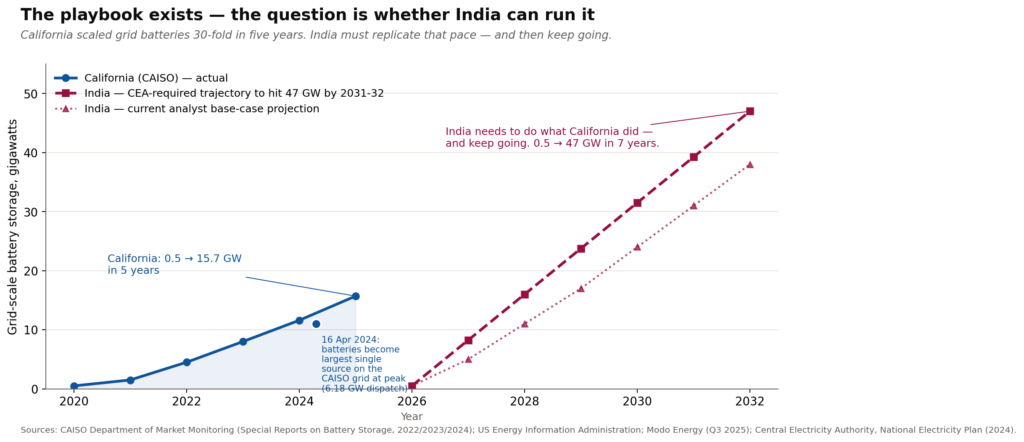
Economics is no longer the binding constraint. Solar-plus-storage tariffs cleared below ₹3.15 per unit in early-2026 auctions, undercutting new coal. Battery tender prices fell more than 40 per cent in 2024. The question is whether India can execute at the pace the playbook requires. California demonstrates it is possible. The state grew its grid-scale battery fleet from roughly 500 megawatts in 2020 to 15.7 gigawatts by January 2025 — a thirty-fold expansion in five years. On 16 April 2024, batteries became the single largest source of generation on the CAISO grid during the evening peak, delivering 6.18 gigawatts at 8.10 pm and displacing gas. India must replicate that trajectory and then keep going.
The third is inertia. Coal turbines have rotating mass; solar panels do not. Between January 2022 and July 2025, the Central Electricity Regulatory Commission recorded 68 separate events in which more than a gigawatt of renewable generation was suddenly lost to the grid. Each is a near-miss for system frequency. India commissioned its first synchronous condenser earlier this year and the CEA opened a public consultation on grid-forming inverter standards in January 2026.
This is where Spain’s experience matters most. The official ENTSO-E expert report on the 28 April 2025 blackout, finalised in March 2026, identified voltage control failures and inadequate reactive power management as the proximate causes. The deeper, technically uncontested reading is that an inverter-based share of 59 per cent had so reduced system inertia and dynamic voltage support that, once frequency began to deviate, there was almost nothing rotating in the system to slow it down. Tens of millions of people lost power for up to 18 hours. The financial cost has been estimated at €4–6 billion. Spain had received its own warnings before that morning. The regulator did not act in time.
The good news is that the solution is now off-the-shelf. South Australia’s Hornsdale Power Reserve, a 150 MW Tesla battery, became in 2022 the first grid-scale battery in the world to provide synthetic inertia at scale via grid-forming inverters. It now supplies about 15 per cent of the state’s projected inertia shortfall. Australia is expected to operate around 4.5 GW of grid-forming BESS by the end of 2025. The cost per megawatt-second of inertia from a grid-forming battery is a fraction of a dedicated synchronous condenser — and the same asset earns revenue from energy arbitrage and ancillary services. India’s regulator should make grid-forming capability a mandatory feature of every utility-scale storage tender, not a future consultation item.
The deeper failure is institutional. Reform debates have been framed around generation — auctions, tariffs, capacity targets — because that is where political success is most legible. Grid hardware, storage and ancillary services were treated as adjuncts to capacity, not co-equal infrastructure. The Production-Linked Incentive scheme reflects the same bias: subsidise the asset, neglect the system that operates it. The result is a power sector optimised for the press release. What it lacks is the unglamorous middle layer — substations, condensers, batteries, dispatch software, smart meters — that converts gigawatts on the ground into reliable kilowatt-hours at the socket.
A grid that cannot store electricity must instead shift the time at which it is consumed. India’s time-of-day tariffs, mandatory since April 2025 for most non-agricultural consumers, are the right instrument. California demonstrates how powerful demand-side reform can be when policy follows through. The state’s NEM 3.0 net-metering reform pushed roughly 40 per cent of new solar applications to co-locate batteries by 2024-25, up from 13 per cent in 2023. Enforcement, not engineering, did the heavy lifting. India’s smart-metering programme, itself stalled by misaligned incentives at the last mile, is the missing scaffolding for any serious demand-flexibility regime. The grid problem and the metering problem are, at root, the same problem.
The interim answer has been to flex coal plants — lowering minimum loads from 55 per cent to 40 per cent to absorb the midday solar surge. NTPC has reported 692 boiler-tube leaks across its fleet between 2021-22 and September 2025, partly attributed to such cycling. This buys headroom at the cost of plant integrity. It cannot be the strategy; it is a holding action.
India’s renewable buildout is one of the great industrial achievements of the decade. Its grid is its weakest link. The country today sits somewhere between California in 2018 and Spain in early 2025 — high renewable penetration, visible warning signs, regulators discussing rather than mandating the fixes. The technologies that California, South Australia and Australia more broadly have proven are off-the-shelf. They are deployable now. The question is whether India will commit the capital and political will, in time.
The renewable transition will not be judged by how much capacity India built. It will be judged by how reliably that capacity reaches the consumer when needed. On that scoreboard the country has perhaps three to five years to decide which trajectory it is on. After that, the answer arrives whether the policy is ready or not.
References
A. The opening event: 25–26 April 2026 peak and the night-time shortfalls
- Ministry of Power, Government of India / PIB. “India Meets All-Time Highest Peak Power Demand of ~256 GW Without Shortage.” Press release, 26 April 2026. https://www.pib.gov.in/PressReleasePage.aspx?PRID=2256313
- Business Standard. “Solar powers India as electricity demand hits record high of 256 GW.” 27 April 2026. https://www.business-standard.com/india-news/india-record-power-demand-256gw-solar-generation-april-heatwave-126042700556_1.html
- DD News. “India meets record peak power demand of 256 GW without shortage, sets new benchmark.” 26 April 2026. https://ddnews.gov.in/en/india-meets-record-peak-power-demand-of-256-gw-without-shortage-sets-new-benchmark/
- Vajiram & Ravi Current Affairs. “India’s Night-Time Energy Crisis.” April 2026. https://vajiramandravi.com/current-affairs/indias-night-time-energy-crisis/
B. IEX intra-day price swings (Chart 1)
- Business Standard. “What is driving the volatility in India’s spot power prices?” 12 May 2026. https://www.business-standard.com/industry/news/what-is-driving-the-volatility-in-india-s-spot-power-prices-126051201473_1.html
- Bloomberg. “India Power Prices Swing Wildly Pointing to Night Supply Crunch.” 23 April 2026. https://www.bloomberg.com/news/articles/2026-04-23/india-power-prices-swing-wildly-pointing-to-night-supply-crunch
- Electrical Mirror / IEX. “IEX Records Strong April 2026 Growth – Monthly Power Market Update.” May 2026. https://electricalmirror.net/indian-energy-exchange-april-2026-monthly-power-market-update/
- Central Electricity Regulatory Commission. Order in Petition No. 359/MP/2022 — Approval of HP-DAM at IEX, 16 February 2023. https://cercind.gov.in/2023/orders/359-MP-2022.pdf
- CERC. Report on Short-Term Power Market in India, 2022-23 — Chapter II.https://cercind.gov.in/2023/market_monitoring/Annual-2022-23/Chapter-II/AR-22-23_Chapter-II.pdf
C. Capacity build, fuel mix and FY26 additions
- Organiser. “No Blackouts at Peak: India Meets Record Electricity Demand of 256 GW.” 29 April 2026. https://organiser.org/2026/04/29/351143/bharat/
- Mercom India. “Santosh Kumar Sarangi Appointed as the New MNRE Secretary.” 22 April 2025. https://www.mercomindia.com/santosh-kumar-sarangi-appointed-as-the-new-mnre-secretary
- Energetica India. “India Can Emerge as Global Hub for Renewable Manufacturing, Exports, Says MNRE Secretary.” 27 February 2026. https://energetica-india.net/news/india-can-emerge-as-global-hub-for-renewable-manufacturing-exports-says-mnre-secretary
D. Transmission build-out and capex comparison (Chart 2)
- India Brand Equity Foundation. “India to spend over Rs 9 trillion (US$107.89 bn) on power transmission infra by 2032.” November 2024. https://www.ibef.org/news/india-to-spend-over-rs-9-trillion-us-107-89-billion-on-power-transmission-infra-by-2032-govt
- Business Today. “Centre targets Rs 9.15 lakh crore investment opportunity in transmission sector by 2032.” 15 October 2024. https://www.businesstoday.in/latest/economy/story/centre-targets-rs-915-lakh-crore-investment-opportunity-in-transmission-sector-by-2032-450046-2024-10-15
- Deccan Herald / Bloomberg. “India to revamp renewable energy by 2030, plans Rs 9.15 lakh crore investment in transmission for green power.” October 2024. https://www.deccanherald.com/business/india-to-revamp-renewable-energy-by-2030-plans-rs-915-lakh-crore-investment-in-transmission-for-green-power-3233111
- Ministry of Power / Business Standard. “Rs 2.44-trn plan for 500-GW renewable energy transmission launched.” 7 December 2022. https://www.business-standard.com/article/economy-policy/rs-2-44-trillion-transmission-investment-plan-for-500-gw-re-till-2030-122120701197_1.html
- SASAC (China). “State Grid Plans 4 Trillion Yuan Fixed Assets Investment in Next 5 Years.” 22 January 2026. http://en.sasac.gov.cn/2026/01/22/c_20333.htm
- OilPrice / Reuters. “China’s Grid Giant Plans Huge $574 Billion Investment Surge.” 15 January 2026. https://oilprice.com/Latest-Energy-News/World-News/Chinas-Grid-Giant-Plans-Huge-574-Billion-Investment-Surge.html
- ARC Advisory Group. “State Grid’s Plan to Invest RMB 4 Trillion During China’s 15th Five-Year Plan Period.” 22 January 2026. https://www.arcweb.com/blog/state-grids-plan-invest-rmb-4-trillion-during-chinas-15th-five-year-plan-period
E. Germany’s transmission bottleneck (Energiewende parallel)
- Bundesnetzagentur (Federal Network Agency, Germany). Monitoring Report on Network Expansion / Redispatch Costs. Annual series; redispatch costs reached €4.2 bn in 2022 before easing to €3 bn in 2024. https://www.bundesnetzagentur.de/EN/Areas/ElectricityGas/NetworkExpansion/start.html
- TenneT TSO / 50Hertz / Amprion. SuedLink and SuedOstLink HVDC Corridor Updates, project pages. https://www.tennet.eu/projects/suedlink/ ; https://www.50hertz.com/en/grid/gridprojects/suedostlink
F. Curtailment data — India and China
- SaurEnergy / CREA. “India Hits 256 GW Peak Power Demand in Q4, RE Curtailment Rises Too.” May 2026. https://www.saurenergy.com/solar-energy-news/india-hits-256-gw-peak-power-demand-in-q4-re-curtailment-rises-too-11781630
- Carbon Brief. “Analysis: Record solar growth keeps China’s CO₂ falling in first half of 2025.” 11 November 2025. https://www.carbonbrief.org/analysis-record-solar-growth-keeps-chinas-co2-falling-in-first-half-of-2025/
- Reuters. “As China’s renewable capacity soars, utilisation lags, data show.” August 2025. https://tr.tradingview.com/news/reuters.com%2C2025%3Anewsml_L4N3TX0KQ%3A0-as-china-s-renewable-capacity-soars-utilisation-lags-data-show
- Power Technology. “China faces rising renewable energy curtailment.” 6 August 2025. https://www.power-technology.com/news/china-renewable-energy-curtailment/
G. Storage gap and battery economics (Chart 3)
- India Energy & Climate Center, UC Berkeley. Strategic Pathways for Energy Storage in India through 2032.August 2025. https://iecc.gspp.berkeley.edu/resources/reports/strategic-pathways-for-energy-storage-in-india-through-2032/
- DC&T Global. “India’s BESS Boom: 2026, the Energy Storage Turning Point.” May 2026. https://www.dcntglobal.com/indias-bess-boom-why-2026-is-a-watershed-year-for-energy-storage/
- KPIAS Academy. “Energy Storage in India 2026.” May 2026. https://kpiasacademy.com/energy-storage-india-renewable-energy-transition-challenges/
- Ember. “Battery storage is now cheap enough to unleash India’s full solar potential.” 16 April 2026. https://ember-energy.org/latest-insights/battery-storage-is-now-cheap-enough-to-unleash-indias-full-solar-potential/
H. California’s battery scale-up (Chart 5)
- California Independent System Operator (CAISO), Department of Market Monitoring. 2022 Special Report on Battery Storage, 7 July 2023. https://www.caiso.com/documents/2022-special-report-on-battery-storage-jul-7-2023.pdf
- CAISO Department of Market Monitoring. 2023 Special Report on Battery Storage, 16 July 2024. https://www.caiso.com/notices/department-of-market-monitoring-2023-special-report-on-battery-storage-posted
- CAISO Department of Market Monitoring. 2024 Special Report on Battery Storage, 29 May 2025. https://www.caiso.com/documents/2024-special-report-on-battery-storage-may-29-2025.pdf
- Modo Energy. “CAISO adds 1.6 GW of BESS as the battery fleet nears 15 GW.” 17 October 2025. https://modoenergy.com/research/en/caiso-battery-buildout-long-duration-bess-hybrid-colocated
- Yes Energy. “The CAISO Energy Storage Revolution: Meeting California’s Climate and Load Challenges.” 13 February 2026. https://www.yesenergy.com/blog/the-caiso-energy-storage-revolution
- Energy Central. “Batteries Battling The Duck Curve” — for the 16 April 2024 6.18 GW evening battery dispatch record. 3 June 2024. https://energycentral.com/c/em/batteries-battling-duck-curve
- Clean Coalition. “Flattening California’s Duck Curve with Local Solar.” 23 January 2025. https://clean-coalition.org/news/flattening-californias-duck-curve-with-local-solar-and-battery-storage/
- FactSet Insight. “From Duck to Canyon: How CAISO’s Load Profile Has Evolved.” 29 August 2025 — NEM 3.0 and the 40%/13% co-located solar-storage statistic. https://insight.factset.com/from-duck-to-canyon-how-caisos-load-profile-has-evolved
I. South Australia and grid-forming inverters
- Neoen. “Neoen and Tesla deliver innovative inertia services at Hornsdale Power Reserve big battery in Australia.” 27 July 2022. https://neoen.com/en/innovations/neoen-tesla-deliver-innovative-inertia-services-hornsdale-power-reserve-big-battery-australia/
- pv magazine Australia. “Hornsdale big battery begins providing inertia grid services at scale in world first.” 27 July 2022. https://www.pv-magazine-australia.com/2022/07/27/hornsdale-big-battery-begins-providing-inertia-grid-services-at-scale-in-world-first/
- Energy-Storage.News. “Tesla’s Hornsdale Power Reserve provides inertia to South Australia’s grid.” 31 May 2023. https://www.energy-storage.news/upgrade-at-tesla-battery-project-demonstrates-feasibility-of-once-in-a-century-energy-transformation-for-australia/
- Blackridge Research. “Tesla Expects 4.5 GW Grid-Forming BESS Operating in Australia.” 10 September 2025. https://www.blackridgeresearch.com/news-releases/tesla-expects-45gw-grid-forming-battery-storage-operating-australia
- PSC Consulting. “Australia leans in on synthetic inertia for grid stability.” August 2022 — for the Callide C explosion (May 2021) Hornsdale frequency response. https://www.pscconsulting.com/australia-leans-in-on-synthetic-inertia-for-grid-stability/
J. The Iberian blackout, 28 April 2025
- ENTSO-E Expert Panel. Final Report on the 28 April 2025 Iberian Blackout. March 2026. https://www.entsoe.eu/news/2026/03/20/iberian-blackout-final-report/
- WindEurope / ENTSO-E. “Iberian Blackout: ENTSO-E report puts spotlight on grid resilience and voltage control – not on renewables.” 4 November 2025. https://windeurope.org/news/iberian-blackout-entso-e-report-puts-spotlight-on-grid-resilience-and-voltage-control-not-on-renewables/
- Enlit World. “ENTSO-E releases final report into Iberian blackout.” 20 March 2026. https://www.enlit.world/library/final-entso-e-reports-sheds-light-on-multiple-factors-that-caused-iberian-blackout
- Red Eléctrica de España. Blackout in Spanish Peninsular Electrical System on the 28th of April 2025 — Incident Report. 18 June 2025. https://d1n1o4zeyfu21r.cloudfront.net/WEB_Incident_%2028A_SpanishPeninsularElectricalSystem_18june25.pdf
- Ministerio para la Transición Ecológica y el Reto Demográfico (MITECO, Spain). Official Investigation Report on the Iberian Blackout. June 2025. https://www.miteco.gob.es/ (linked via the report’s Spanish-language press release)
- PV-Tech. “Investigation finds renewables not responsible for Spain’s April blackout.” 18 June 2025. https://www.pv-tech.org/investigation-renewables-not-responsible-spains-april-blackout/
- Grid Strategies LLC. “A review of reports on Spanish blackout causes and solutions.” 25 June 2025. https://gridstrategiesllc.com/project/a-review-of-reports-on-spanish-blackout-causes-and-solutions/
- SMC Int. “Analysis of Spain’s April 2025 Blackout: Causes, Low-Inertia Grid Risks, and Protection Solutions.” 12 May 2025. https://smcint.com/electrical-testing/analysis-of-spains-april-2025-blackout-causes-low-inertia-grid-risks-and-protection-solutions/
K. Coal-plant flexibilisation and damage (Chart 4)
Power Line Magazine. “Ensuring Grid Stability: Flexibilisation strategies in thermal power generation.” 8 September 2025. https://powerline.net.in/2025/09/08/ensuring-grid-stability-flexibilisation-strategies-in-thermal-power-generation/
Business Standard. “NTPC flags thermal plant damage from flexible ops for renewable integration.” 20 February 2026. https://www.business-standard.com/industry/news/ntpc-warns-of-damage-to-thermal-plants-from-flexible-operations-126022000800_1.html
SolarQuarter. “CEA Panel Flags Thermal Plant Stress As India Pushes Flexible Operations For 500 GW Renewable Target.” 21 February 2026. https://solarquarter.com/2026/02/21/cea-panel-flags-thermal-plant-stress-as-india-pushes-flexible-operations-for-500-gw-renewable-target/